[ NODAR Technology ]
Technology Overview
How NODAR's Ultra-Wide Baseline Stereo Vision Achieves 1,000-Meter 3D Sensing
The Science Behind Ultra-Wide Baseline Stereo Vision
NODAR's Hammerhead software enables standard stereo cameras to produce dense, accurate 3D point clouds at ranges up to 1,000 meters — far beyond the ~5-meter limit of conventional stereo vision. It does this by widening the distance between two cameras (the baseline) from the typical few centimeters to 0.5–3 meters or more, then solving the calibration problem that previously made wide-baseline stereo impractical for outdoor deployment. The result is a passive, software-defined 3D sensing system that runs on off-the-shelf cameras, requires no LiDAR, and automatically recalibrates every frame without human intervention. This page describes the technical principles behind Hammerhead and GridDetect, NODAR's two core software products.
Hammerhead
Hammerhead is NODAR's stereo vision software that converts raw images from two standard cameras into dense 3D point clouds at ranges up to 1,000 meters, using triangulation-based depth measurement rather than inferred or neural-network-based estimation.
Triangulation is a reliable method for estimating range, like a tape measure. It is a direct measurement and is not inferred from tangential information (such as monocular depth estimation). The range to an object can be expressed explicitly as a function of the angles from two cameras and the distance between the cameras.
How Does Increasing the Stereo Baseline Improve Range at Long Distance?
Increasing the distance between two stereo cameras — the baseline — directly improves range resolution. This relationship is what allows NODAR's ultra-wide baseline stereo vision (0.5–3m+ baselines) to achieve accurate 3D sensing at distances exceeding 1,000 meters, far beyond the ~5-meter limit of standard stereo cameras.
In fact, the depth uncertainty (sometimes called range resolution) is proportional to the baseline length. Therefore, for the same camera resolution and optics, increasing the baseline by a factor of 10, decreases the depth uncertainty by a factor of 10. A photo of a 0.5-m-baseline stereo camera is shown next to a 0.05-m-baseline stereo camera in Fig. 1.

Fig. 1. Ultra-wide-baseline stereo camera with 0.5-m baseline vs. standard stereo camera with 0.05-m baseline.
The depth uncertainty, Δz, for a stereo vision camera is derived in Fig. 2, and is equal to:

Eq. 1
where IFOV is the instantaneous field of view, R is the range to the object, 𝛅 is the disparity measurement resolution (𝛅=0.1 pixels for Hammerhead software), and B is the baseline length. Fig. 2 shows graphically that as the baseline increases, the depth uncertainty improves.

Fig. 2. Depth uncertainty improves as the baseline length gets bigger.
The equation for depth uncertainty, Eq. 1, also shows that it increases as the square of the range, i.e., R², which is the main reason why previous stereo vision cameras were limited to less than about 5-meter range. The depth uncertainty is plotted as a function of range in Fig. 3 for both LiDAR and stereo vision systems. Note that the substitution, IFOV = 1/f, was used. The range resolution is the distance between two objects before they blend together in range, i.e., how well can the system resolve two closely-spaced objects in range. To be clear, range resolution is not signal-dependent and is not the same as range precision or range accuracy. Precision is derived from resolution by averaging multiple returns and depends on SNR, which is range-dependent.
The range resolution of LiDAR is the point spread function in range, that is, it is the spread of returns from a flat normal target, and is equal to the bandwidth of the LiDAR transceiver. Typically, LiDARs have 4-ns pulses with a matching 250-MHz optoelectronic receiver, which corresponds to a range resolution of 60 cm. Fig. 3 shows a horizontal line for LiDAR (orange line), showing that the range resolution is the same for all ranges, because the resolution only depends on the laser pulse width (more precisely, the LiDAR transceiver bandwidth).

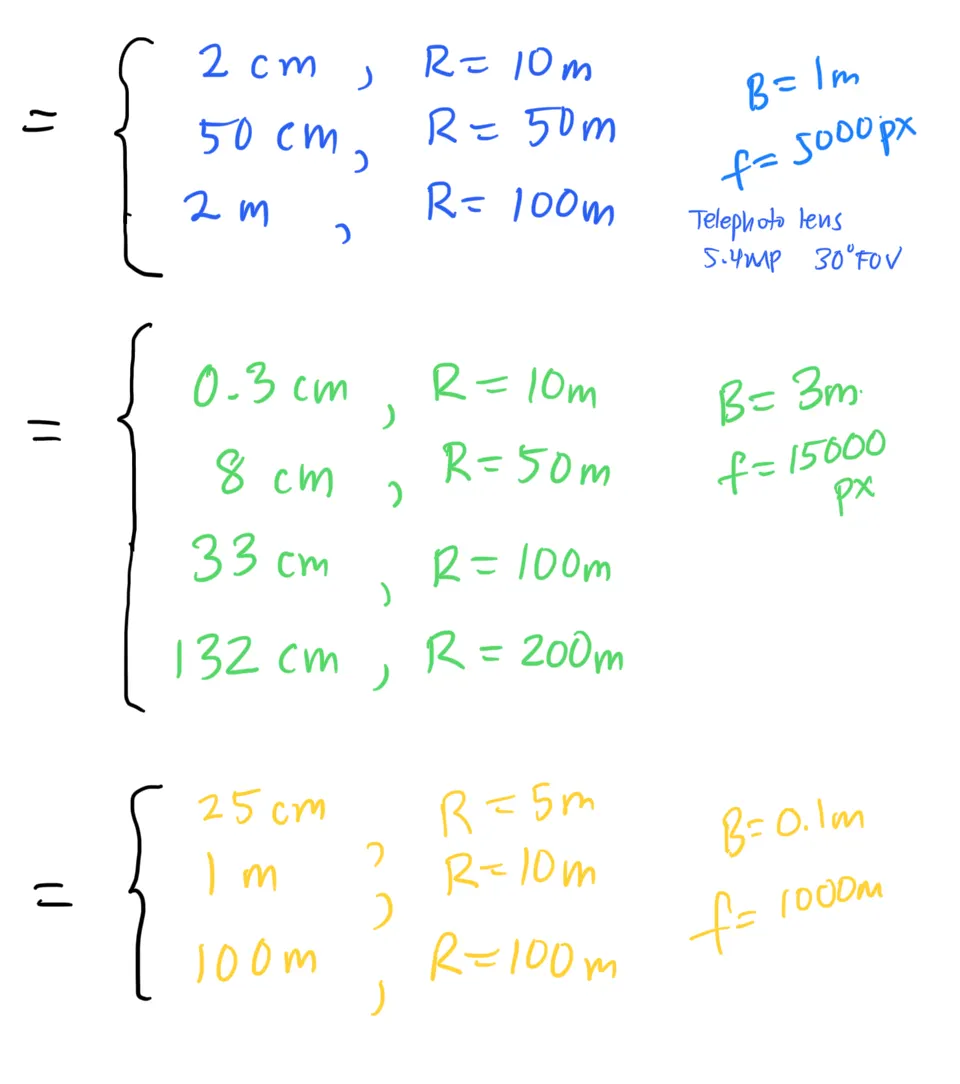
Fig. 3. Range resolution vs. range.
How Does Hammerhead Calibrate Stereo Cameras Automatically Without Checkerboards?
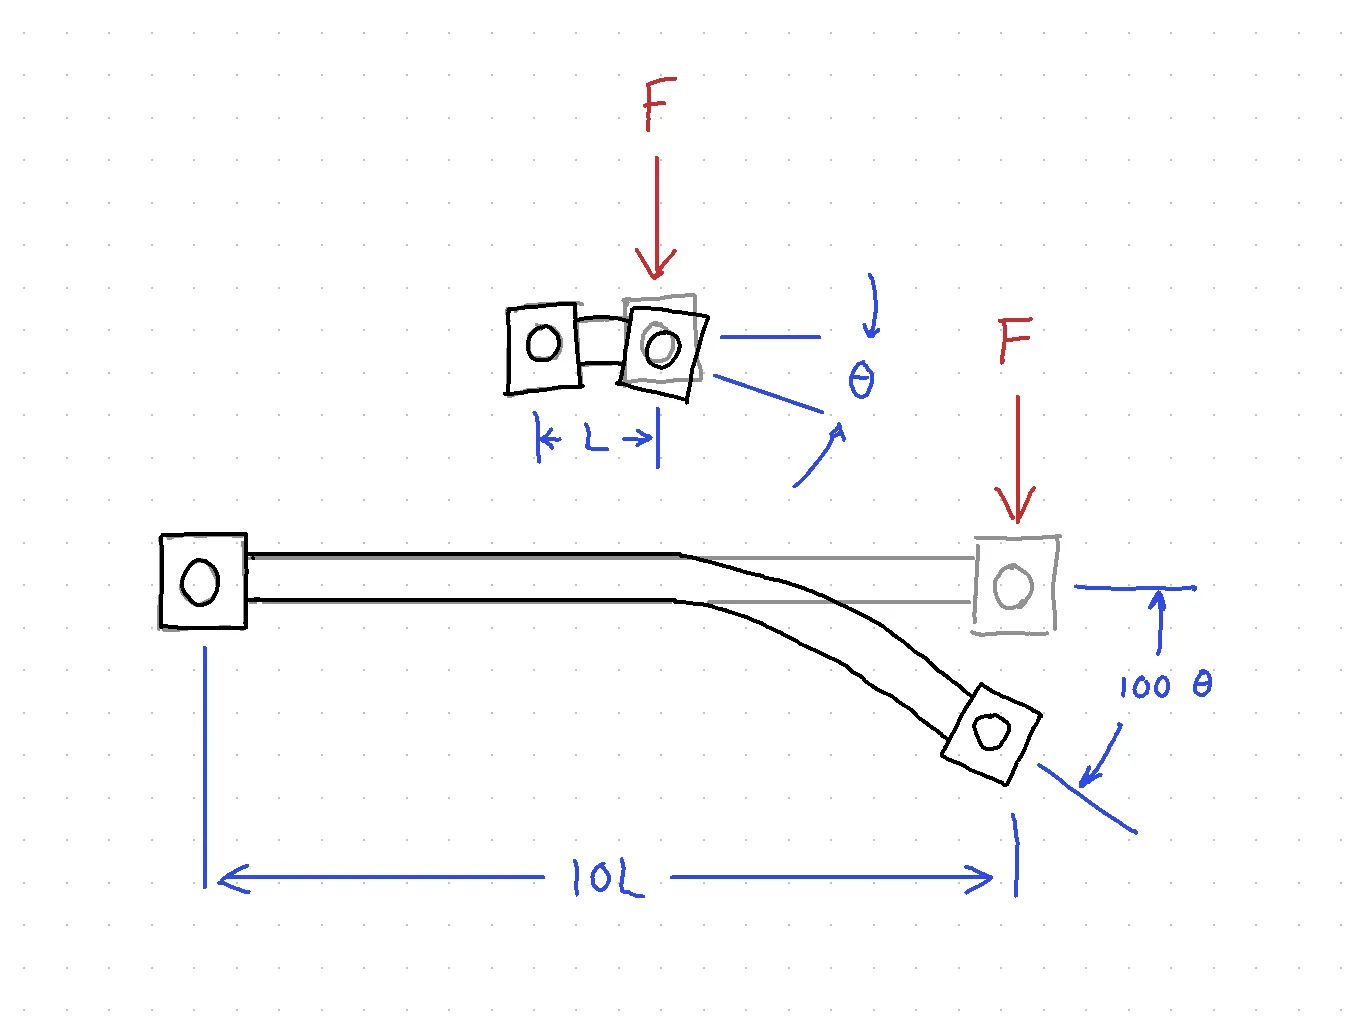
Hammerhead solves the primary obstacle that previously made wide-baseline stereo vision impractical for outdoor deployment: automatic, frame-by-frame calibration without human intervention or calibration targets. Prior systems required daily manual recalibration using checkerboard patterns because vehicle vibration causes angular camera shifts that grow with the square of the baseline length — a 10x wider baseline produces 100x more angular disturbance from the same force. Stereo vision relies on measuring tiny angles to determine object locations, making it highly sensitive to disruptions. Even minute angular shifts of just 0.01° in the cameras could result in significant range errors or render the stereo matcher unable to find reliable correspondences, preventing it from reporting any range data.
In fact, the angular disturbance of cameras caused by environmental factors increases with the square of the baseline length, effectively limiting practical stereo vision systems to baseline lengths of just a few tens of centimeters. While longer baseline systems have been documented in the literature, they are predominantly confined to indoor, static applications and require frequent recalibration. Fig. 4 shows that the same force on the end of a narrow- and wide-baseline stereo camera causes the slope at the end of the wider beam to deflect 100 times more than the narrower beam. For more details, we provide an application note that explains the necessity of frame-to-frame calibration [here].
The inconvenient truth is that previous vehicle-mounted stereo camera systems required daily calibration to address subtle shifts in camera positions caused by the shocks and vibrations of regular driving. This calibration process was time-consuming, typically involving capturing 20-40 images of checkerboards or calibration patterns positioned at various angles and distances relative to the cameras. Moreover, systems with ultra-wide baselines, particularly those using telephoto lenses, demanded calibration boards of impractically large size. Hammerhead solves these practical calibration issues and enables ultra-wide baseline stereo vision.
Hammerhead autocalibration uniquely solves three challenges needed for commercial wide-baseline stereo vision:
Natural scenes. Products cannot be shipped with engineers and calibration checkerboards. The stereo camera must be able to automatically calibrate from natural scenes without human intervention.
Bandwidth. Shock, and engine and road vibration are at higher frequencies (100-300 Hz) than the frame rate of the camera (~30 Hz), and hence every frame must be calibrated independently. This is necessary for on- and off-road robotic applications. In the past, automatic calibration every frame was computationally prohibitive, but NODAR’s breakthrough algorithms efficiently solve the calibration problem in real time.
Accuracy. Hammerhead offers sub-pixel reprojection error for accurate and best-in-class ranging at long ranges.
Hammerhead achieves all three requirements simultaneously. Previous autocalibration algorithms use the “keypoint approach:” keypoints are found in the left and right images and a rigid geometry assumption allows for the estimate of the camera extrinsic camera parameters. Keypoint approaches fail for several reasons:
Incorrect matches. Especially in urban environments, with repeated structures, such as windows, keypoints can be incorrectly matched. Even one incorrect match leads to unusable results.
Incorrect locations. Rounded corners, which are common in natural scenes, do not have a sharp features and keypoints (SIFT, ORB, etc) select and incorrectly match different parts of rounded corners from the left to right images.
Poor accuracy. Some keypoint types are not accurate to sub-pixel accuracy and are inherently inaccurate.
Poor keypoint distribution. Keypoints are often clustered at the horizon or in certain spots of the image, and do not provide even sampling across the image, which reduces the estimation accuracy of the extrinsic camera parameters.
Hammerhead does not use keypoints to determine camera parameters and does not assume infinitely sharp points (like corners in a checkerboard), but rather looks at all pixels in the image to determine calibration.
How Does Hammerhead's Stereo Matcher Work?
Hammerhead's stereo matcher operates at full image resolution with ±0.1-pixel disparity error, processes frames seven times faster than HITnet (a leading KITTI benchmark algorithm), and produces no hallucinated range estimates — every output is a real measurement with an associated confidence value. It is optimized for outdoor robotic applications including adverse weather, low light, and high-dynamic-range conditions.
Full resolution. Unlike most neural network approaches, it operates at the full resolution of the image without downsampling. This allows it to find “the needle in the haystack,” i.e., small objects in a large scene. Processing at full resolution gives extraordinary sharpness without the low-pass filter effect often seen in some neural network approaches.
Fast. Hammerhead stereo matching is seven times faster than HITnet, one of the leading stereo matching algorithms on the KITTI leaderboard.
Accurate. Hammerhead achieves best-in-class ±0.1-pixel disparity error (see datasheet).
No hallucinations. Does not “make up” non-existent information like some neural networks. Every range estimate is real and has an associated confidence value.
Low light. Excellent performance at night.
Image processing, which uses robust feature matching, is highly sensitive and can measure distances to even the most subtle features. Additionally, averaging across pixels further enhances low-light performance.
Superior calibration improves the matching of features in low SNR images. NODAR calibration makes it easier to find features that match in two camera images because (1) the correct windows are matched (see Fig. 4.5), and (2) it reduces the search space from 2D (CNNs) to 1D (along the epipole).
Bad weather. Excellent performance in rain, snow, fog, and dust.
Diffuse illumination from the sky for passive stereo vision sensors is advantageous compared to active LiDAR systems that project light from the transceiver, which suffers from blinding backscattering issues.
Only in extreme rain, snow, and fog conditions does the visibility reduce below 100 meters. Excellent range estimates can be obtained as long as the visibility matches the range of interest. LiDAR, on the other hand, will often fail in light rain and fog conditions.
(Check out the IEEE article here on NODAR's weather performance.)
Dawn and Dusk. Excellent HDR performance even with the sun directly in the camera image.
Hammerhead is compatible with rolling shutter cameras, which offer the highest dynamic range of CMOS sensors (compared to global shutters, common in stereo vision cameras).

Our stereo matching not only works with visible cameras, but with LWIR (thermal), MWIR, SWIR, and NIR cameras. This video shows a 1-m baseline LWIR stereo camera while driving on the highway, using FLIR ADK cameras.
What Does the Hammerhead Processing Pipeline Look Like?
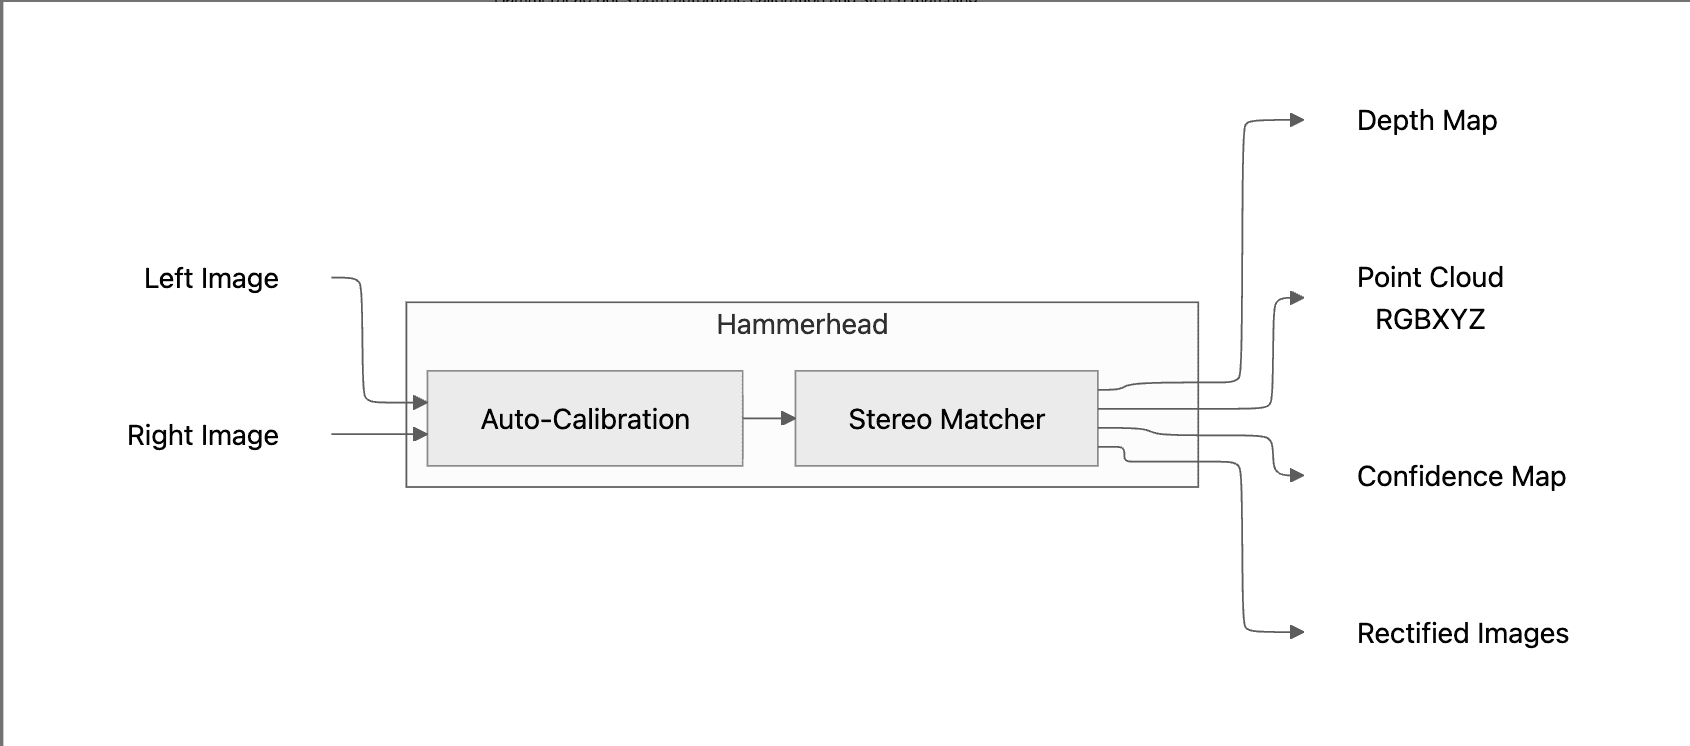
Hammerhead is a binary library that converts raw images from two cameras into colorized 3D point clouds. The library mainly uses GPU resources and is currently compiled for Nvidia GPUs. Fig. 5 shows a block diagram of the inputs, outputs, and intermediate computational blocks. Hammerhead does both automatic calibration and stereo matching.
This software library is called “Hammerhead” because the hammerhead shark has the widest distance between the left and right eye in the animal kingdom, with some shark species having a full meter between the eyes. It was discovered in 2009 that Hammerhead sharks have binocular vision, giving them superior depth perception.
GridDetect
NODAR's GridDetect is a software library that converts 3D point clouds into occupancy maps for real-time collision avoidance and drivable space detection. It accepts input from Hammerhead or any other 3D sensor — including LiDAR, radar, or sonar — and compresses high-density point cloud data (Hammerhead produces ~50 million points per second) into a lightweight 2.5D representation that can be transmitted and processed with minimal compute resources.
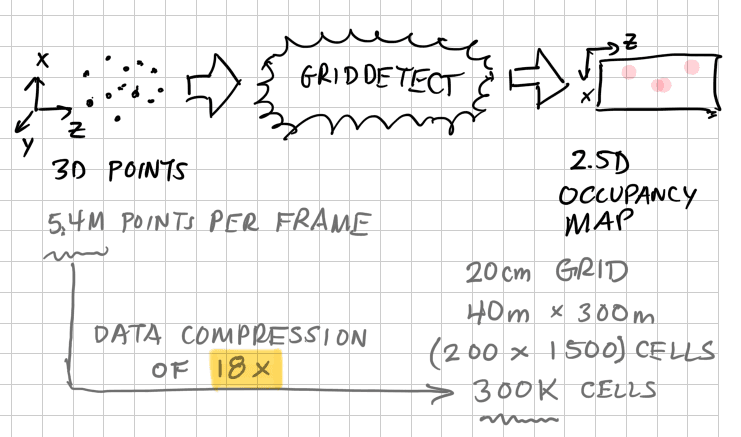
Fig. 6. GridDetect - input and output.
How Does GridDetect Convert a Point Cloud Into an Occupancy Map?
Re-projects 3D points into bird’s eye view (BEV) or top-down view.

2. Bin points into cells that are typically 20 x 20 cm.
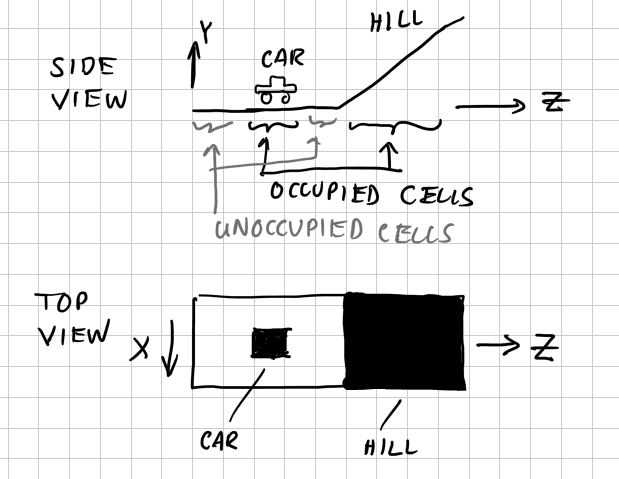
3. Finds cells that are occupied. A cell is occupied when:
a. The object is too high, max(Y), and
b. The slope is too steep, max(dY/dz).
The user defines max(Y) and max(dY/dz) for the vehicle.
Tracks occupied cells over time with a particle filter
Generate particles proportional to the density of 3D points and corrected by
i. Conversion from angle-angle-range (AAR) to XYZ space.
ii. Range-dependent range resolution, i.e., ΔR ∝ R².
b. Propagate particles in time to the next frame. Threshold the number of particles in cells to declare as occupied or not. Go to step (a) and repeat.
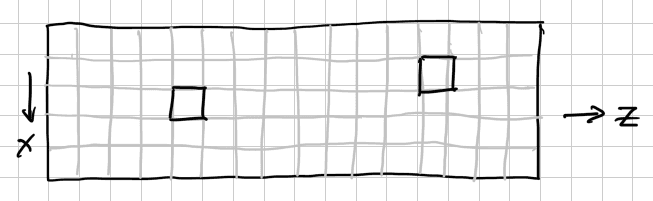
Occupancy map showing two occupied cells.

Each particle has a random velocity (Vx and Vz). The old particles from the previous frames are shown in red.
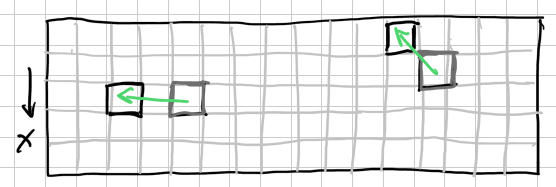
Threshold number of particles in cells to declare as occupied or not.
How Is GridDetect Different From Standard Occupancy Map Software?
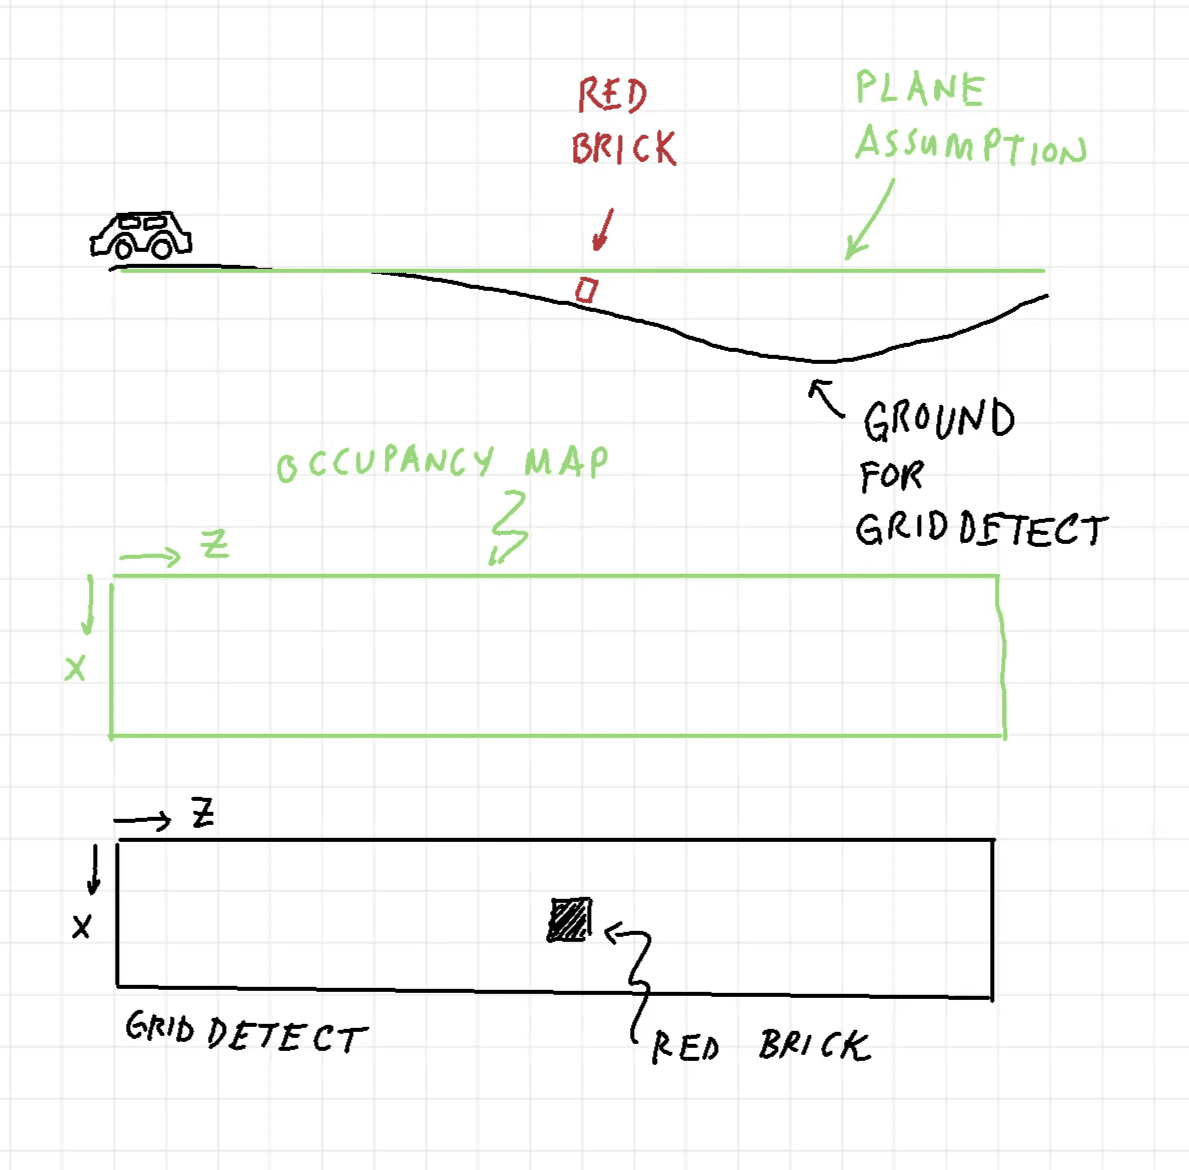
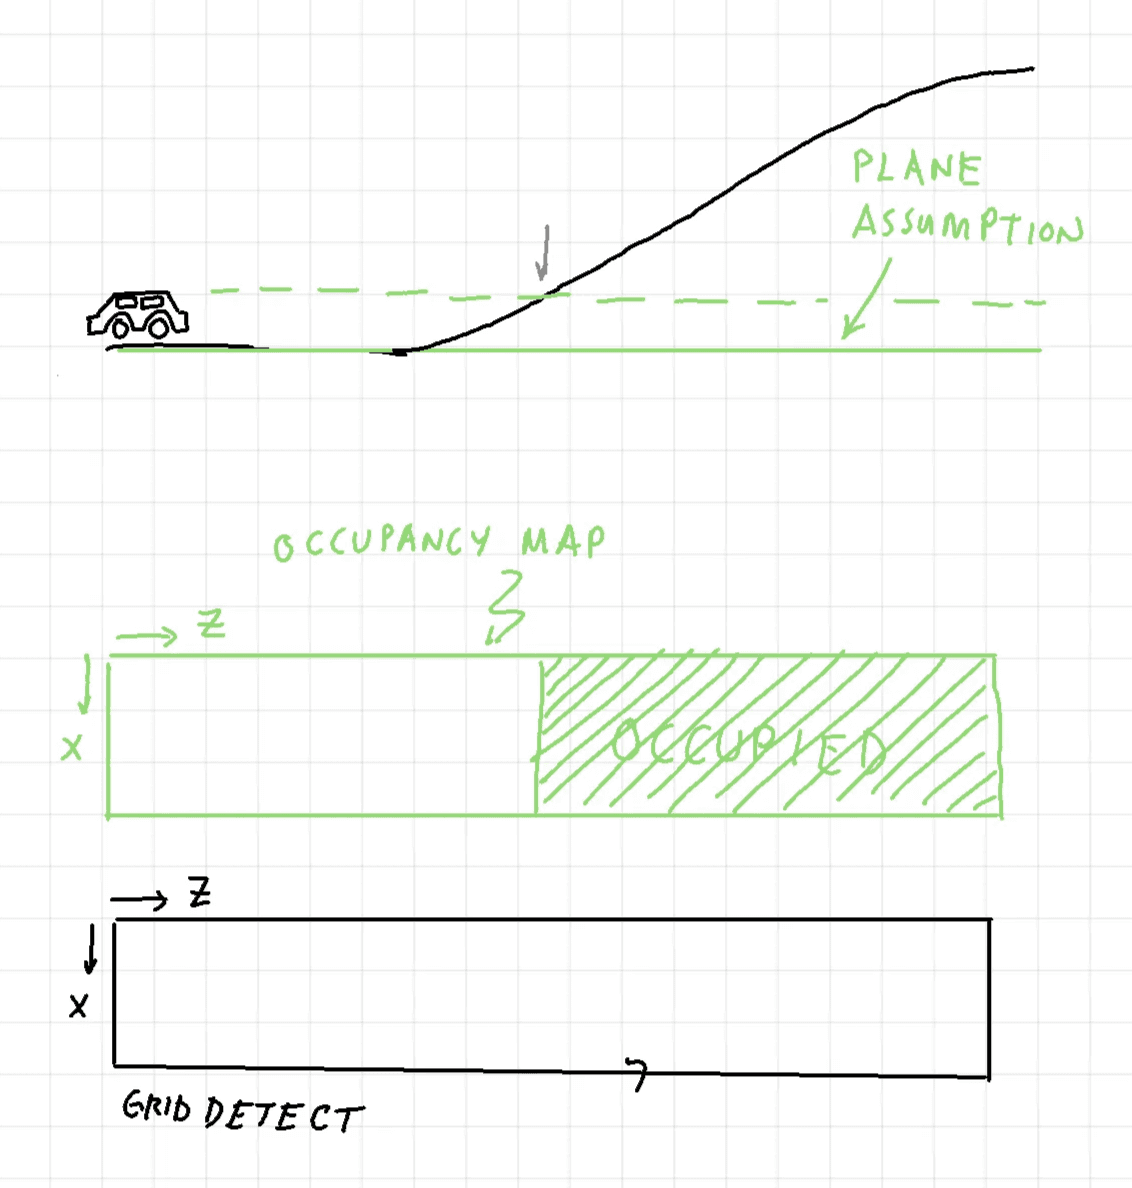
GridDetect detects small objects at long range on uneven terrain — a capability standard occupancy map software lacks. Most occupancy map systems assume a flat ground plane, which fails beyond 50 meters on- and off-road surfaces. GridDetect compensates for terrain variation, enabling reliable detection of objects as small as a brick on a road at distances where ground-plane-assumption systems produce false negatives.
This example shows that a standard occupancy map misses a brick on the road. GridDetect does not.
Hills are not a problem for GridDetect.
Physics-based object detection. Detects objects based on size and volume rather than a neural network approach that interprets pixel colors to determine whether an object is anomalous. We believe this to be a more robust approach with lower false negatives. For example, zebra crossings painted to look 3D to slow down drivers.
Fast. Processes large point clouds into occupancy maps in real time.
What Does the GridDetect Processing Pipeline Look Like?
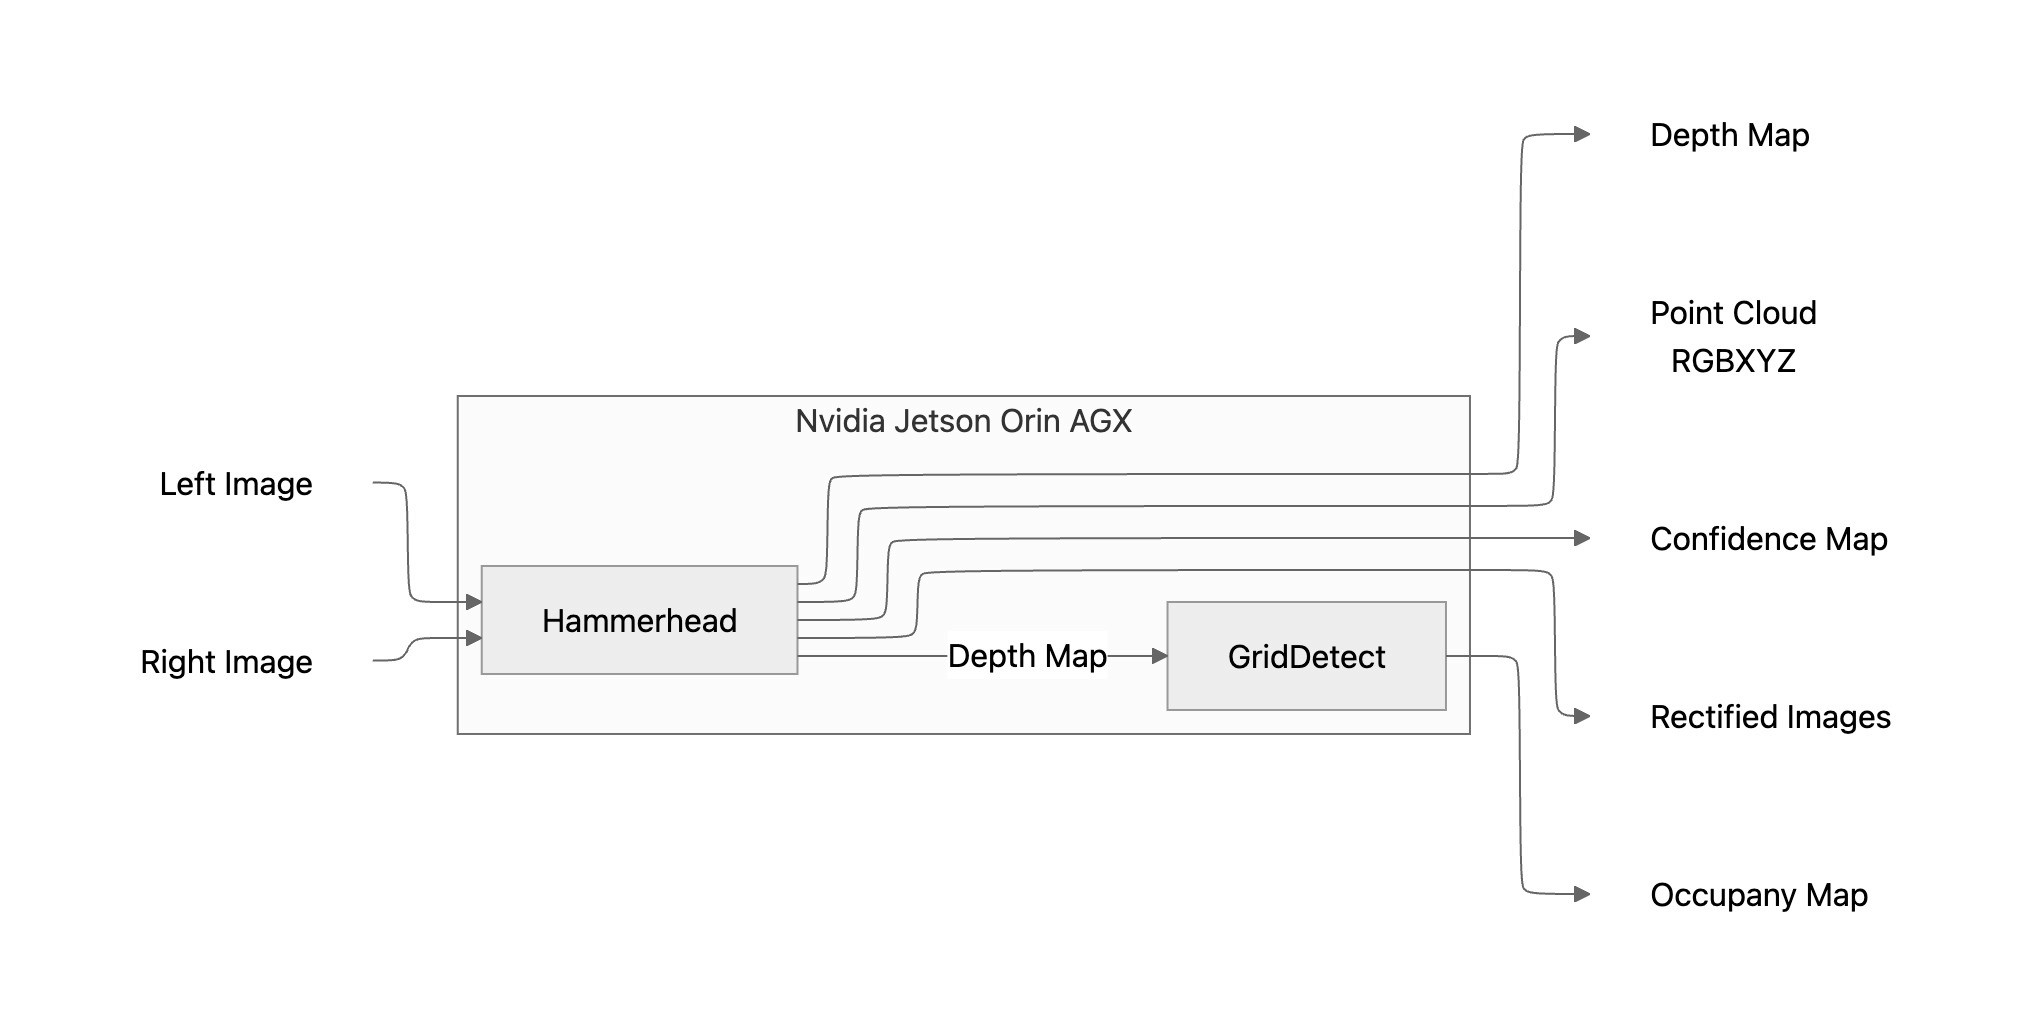
GridDetect is a binary library the converts 3D point clouds into occupancy maps. Fig. 7 shows a block diagram of the inputs, outputs, and intermediate computational blocks.

Fig. 7. GridDetect software block diagram.
Hammerhead and GridDetect Together:
A Complete Stereo Vision Perception Stack
Hammerhead and GridDetect form a complete stereo vision perception pipeline: Hammerhead takes raw images from two cameras and produces dense, calibrated 3D point clouds at ranges up to 1,000 meters; GridDetect takes those point clouds and outputs real-time occupancy maps for collision avoidance and path planning. Together, they replace LiDAR-based perception stacks with a software-defined solution that runs on standard off-the-shelf cameras — across rail, automotive, aviation, mining, maritime, and other demanding applications.